

Strategy Lab #3 — The Signals That Don't Work: A Falsification Framework for Intraday OHLCV Strategies
ENTER Invest · Algorithmic Token · May 2026. Co-developed and co-written by Nuno Edgar Nunes Fernandes, Founder.

Most strategy research shows you what works. This paper shows you what doesn’t — rigorously, across fourteen signal families, on nearly four years of real futures data. The result is more useful than most positive findings, and the framework it implies is what we build here.
A Note on These Strategy Labs
This is the third Strategy Lab post from Algorithmic Token. With these Strategy Labs we aim to produce a first implementation of experimental algorithmic frameworks for trading strategies, that would, conditioned on feedback and positive backtest results, be further developed into proper functional production code. The experimental algorithms generated here are based on the papers we have read and analysed, and where we have found a way for a potential trading strategy implementation. The interested reader may find here their own ideas, and we encourage feedback in the comments section or through direct email, about possible additions or improvements to the experimental algorithms.
This edition is different from the previous two in one important way: the primary paper is a negative result. No strategy selected works. That is the finding. We believe publishing this kind of rigorous falsification is at least as valuable as publishing positive backtest results — and arguably more so, because it tells you where not to look.
The Concept
Every retail trader has encountered the same set of ideas at some point: opening range breakouts, gap fills, VWAP (Volume-Weighted Average Price) rejections, volume spikes, cross-session momentum. These are the bread-and-butter signals of intraday systematic trading, discussed endlessly in forums, sold in courses, and backtested millions of times across the internet.
Most of those backtests are wrong. The reason is not because the person running them is dishonest, but because they are missing the criteria that separate a real edge from a statistical artefact. They are missing walk-forward validation. They are missing realistic transaction costs. They are missing a minimum number of trades for statistical significance. They are missing multi-year stability testing.
When you apply all of those criteria simultaneously to fourteen of the most widely-used intraday signal families — on 947 trading days of five-minute Micro E-mini Nasdaq 100 futures data — none of them pass.
That is the finding of Mesfin (2026). It is not a pessimistic result. It is a clarifying one. Once you know precisely why these signals fail and under which specific criteria each one breaks down, you have a framework for designing signals that might survive. That framework — the falsification harness — is what we implement here.
“Knowing where the edge is not is half of knowing where it is. The other half is harder.”
The Research Basis
Primary reference: Mathias Mesfin (2026) — Structural Limits of OHLCV-Based Intraday Signals in MNQ Futures: A Systematic Falsification Study arXiv:2605.04004 · q-fin.TR · May 5, 2026
Corroborating reference: Garg (2025) — Interpretable Hypothesis-Driven Trading: A Rigorous Walk-Forward Validation Framework for Market Microstructure Signals arXiv:2512.12924 · q-fin.TR
Mesfin tests fourteen signal families — including opening range breakouts, gap strategies, volume signals, cross-session momentum, liquidity grabs, volatility-conditioned classifiers, and news-driven strategies — on 947 trading days of five-minute MNQ data spanning 2021 to 2025. All signals are assessed against strict institutional criteria: out-of-sample walk-forward validation, a minimum T-statistic of 2.0, at least 30 trades, positive net return after a fixed two-point round-trip cost, and multi-year stability. No signal satisfies all criteria simultaneously. The gross edge available to next-bar-open execution is constrained to approximately 0.07–1.50 points per trade — insufficient to overcome transaction costs.
The corroborating paper reaches a consistent conclusion from a different angle. Validating five market microstructure patterns across 100 US equities, the study yields statistically insignificant aggregate results (p-value 0.34) and finds strong regime dependence: positive returns during high-volatility periods while underperforming in stable markets. The key empirical finding is that daily OHLCV-based microstructure signals require elevated information arrival and trading activity to function effectively.
Together these two papers say the same thing: OHLCV signals are not inherently worthless — they are conditionally useful, and the conditions are more restrictive than most practitioners assume.
The Fourteen Signal Families — Why Each Fails
Understanding the failure mode of each signal family is more instructive than any positive backtest result. Here is a structured summary based on Mesfin’s framework:
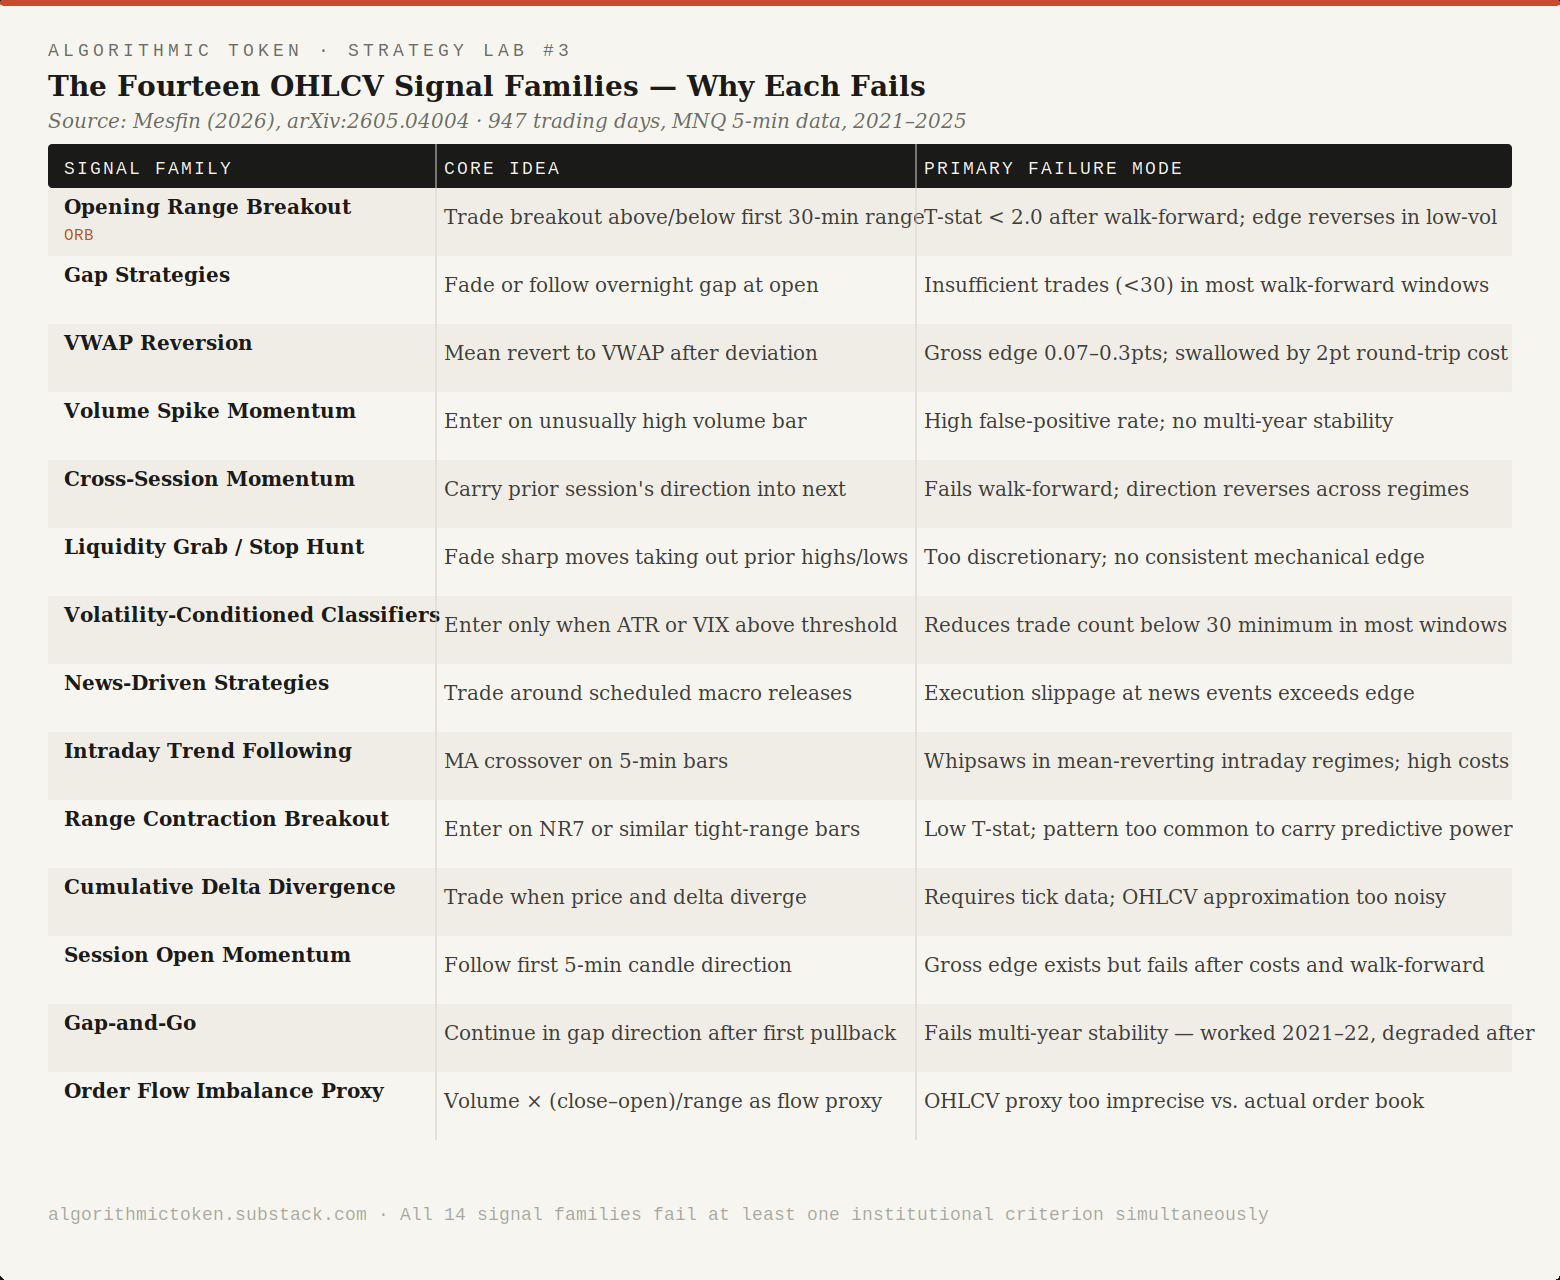
The pattern across these failures is not random. Three structural barriers emerge repeatedly:
Barrier 1 — The cost wall. At 2-point round-trip cost on MNQ (approximately 8–10bps), a strategy needs consistent gross edge above ~1.5 points per trade to survive after costs with any margin of safety. Most OHLCV signals produce 0.07–0.8 points. The gap is structural, not addressable by parameter optimization.
Barrier 2 — Regime instability. Signals that show edge in 2021–2022 (elevated volatility, strong trends) degrade or reverse in 2023–2025 (lower volatility, more choppy mean-reverting conditions). Walk-forward validation, not in-sample optimization, is what exposes this.
Barrier 3 — The OHLCV resolution ceiling. Several signals — cumulative delta, order flow imbalance, liquidity grabs — require tick-level or order-book data to be implemented with fidelity. OHLCV approximations of these signals are too noisy to carry the predictive content the original concepts rely on.
Strategy Logic — The Falsification Harness
Rather than deriving a strategy that works, we derive a testing framework that any signal must survive before being considered. This is the practical implementation of Mesfin’s institutional criteria — a signal screening harness.
The harness does the following: takes any intraday signal function as input, runs it through walk-forward windows, computes the institutional criteria at each window, and produces a pass/fail verdict with diagnostics showing exactly which criterion each window fails and why.
The Five Institutional Criteria
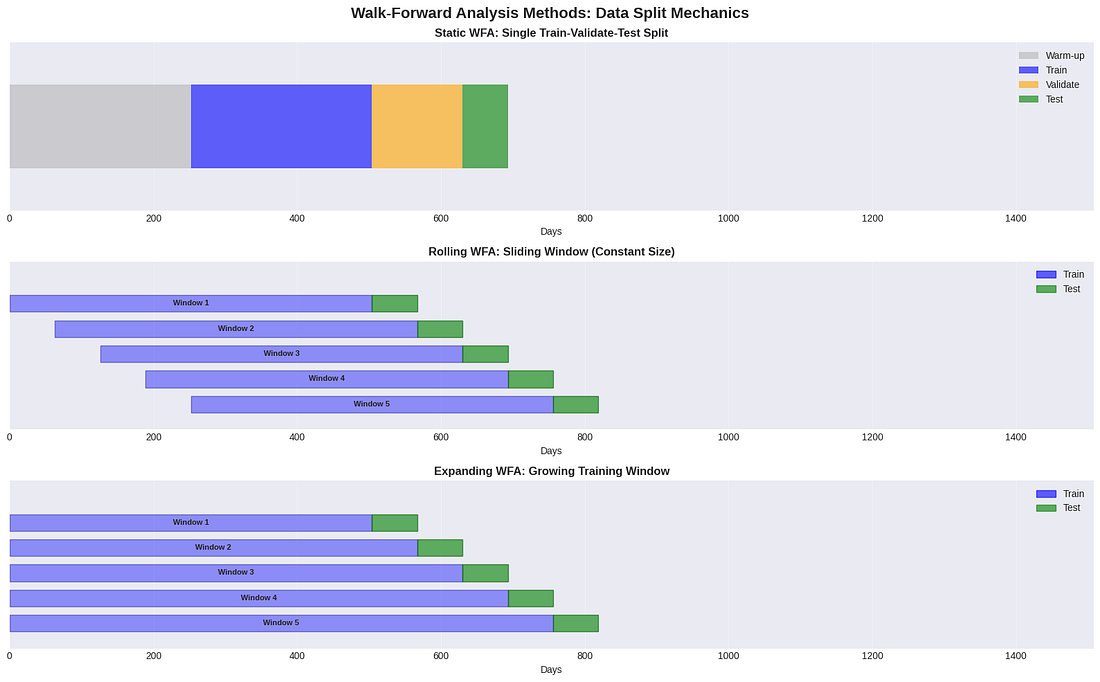
Criterion 1 — Walk-forward validation
    Signal must be trained on a formation window (e.g. 6 months)
    and tested on a subsequent out-of-sample window (e.g. 3 months)
    Minimum 4 non-overlapping windows required

Criterion 2 — Statistical significance
    T-statistic of mean trade P&L / std(trade P&L) * sqrt(n_trades)
    Must exceed 2.0 in every walk-forward window

Criterion 3 — Minimum trade count
    At least 30 trades in each walk-forward window
    (below 30, T-stat is unreliable regardless of value)

Criterion 4 — Positive net return after costs
    Gross P&L per trade > round_trip_cost
    For MNQ futures: round_trip_cost = 2.0 points = $40 per contract
    For retail: use 2.5–3.0 points to be conservative

Criterion 5 — Multi-year stability
    Signal must pass Criteria 1–4 in at least 75% of walk-forward windows
    across the full test period
    Failure rate > 25% = structurally unstable signal
The Key Insight — Conditional Applicability
The falsification study and its corroborating paper together point to a specific modification that may allow OHLCV signals to survive the harness: regime conditioning.
OHLCV-based microstructure signals require elevated information arrival and trading activity to function effectively — generating positive returns during high-volatility periods while underperforming in stable markets.
This implies a two-layer strategy logic:
Layer 1 — Regime filter (applied first):
    Compute 20-day rolling realised volatility
    Compute 5-day average volume relative to 60-day average
    Enter trading mode ONLY if:
        realised_vol > vol_threshold  AND
        relative_volume > vol_threshold
    Otherwise: no trades, flat position

Layer 2 — Signal (applied only in active regime):
    Any of the 14 signal families above
    The regime filter does not fix a broken signal —
    but it removes the periods where even a valid signal
    is most likely to generate false positives
The regime filter does not guarantee a surviving signal. It is a necessary but not sufficient condition. The full harness — all five criteria — must still be passed.
Experimental Algorithm Implementation
# Strategy Lab #3 — Falsification Harness for Intraday OHLCV Signals
# Algorithmic Token · ENTER Invest
# Experimental framework — see risk disclosure
#
# Reference: Mesfin (2026), arXiv:2605.04004
# Corroborating: Garg (2025), arXiv:2512.12924

import numpy as np
import pandas as pd
from scipy import stats
import yfinance as yf


# ---------------------------------------------------------------------------
# Data acquisition — 5-minute OHLCV
# ---------------------------------------------------------------------------

def get_intraday_data(ticker: str = "MNQ=F",
                      period: str = "2y",
                      interval: str = "5m") -> pd.DataFrame:
    """
    Download intraday OHLCV data via yfinance.

    NOTE: yfinance provides maximum 60 days of 5-minute data for free.
    For the full 947-day dataset in Mesfin (2026), a paid data vendor
    is required (e.g. Norgate, Refinitiv, Interactive Brokers API).
    This function is illustrative — substitute your data source here.

    Parameters
    ----------
    ticker   : str — Yahoo Finance futures ticker (MNQ=F for Micro E-mini NQ)
    period   : str — lookback period
    interval : str — bar interval (5m, 15m, 1h)
    """
    df = yf.download(ticker, period=period, interval=interval,
                     auto_adjust=True, progress=False)
    df.index = pd.to_datetime(df.index)
    return df


# ---------------------------------------------------------------------------
# Regime filter — volatility and volume conditioning
# ---------------------------------------------------------------------------

def compute_regime_filter(df: pd.DataFrame,
                           vol_lookback: int = 20,
                           vol_threshold: float = 0.60,
                           volume_lookback: int = 60,
                           volume_ratio_threshold: float = 1.10) -> pd.Series:
    """
    Identify high-information regimes where OHLCV signals are most likely
    to carry predictive content.

    Based on the conditional applicability finding in Garg (2025):
    signals require elevated volatility AND elevated volume to function.

    Parameters
    ----------
    df                      : pd.DataFrame — OHLCV data
    vol_lookback            : int   — rolling window for realised vol (days)
    vol_threshold           : float — vol percentile threshold (0.60 = top 40%)
    volume_lookback         : int   — rolling window for volume baseline
    volume_ratio_threshold  : float — relative volume minimum (1.10 = 10% above avg)

    Returns
    -------
    pd.Series — boolean mask (True = active trading regime)
    """
    returns  = df["Close"].pct_change()
    daily_rv = returns.rolling(vol_lookback * 78).std() * np.sqrt(252 * 78)
    # 78 = approximate 5-min bars per trading day

    vol_condition    = daily_rv > daily_rv.rolling(252 * 78).quantile(vol_threshold)
    relative_volume  = df["Volume"] / df["Volume"].rolling(volume_lookback * 78).mean()
    volume_condition = relative_volume > volume_ratio_threshold

    return vol_condition & volume_condition


# ---------------------------------------------------------------------------
# Example signal — Opening Range Breakout (Signal Family #1 in Mesfin 2026)
# ---------------------------------------------------------------------------

def opening_range_breakout_signal(df: pd.DataFrame,
                                   orb_minutes: int = 30,
                                   bars_per_day: int = 78) -> pd.Series:
    """
    Opening Range Breakout signal on 5-minute bars.

    Enter long when price breaks above the high of the first
    orb_minutes of the session; enter short below the low.
    Exit at end of session.

    This is Signal Family #1 in Mesfin (2026) — the most widely
    discussed intraday signal, and the first to fail the harness.

    Parameters
    ----------
    df           : pd.DataFrame — OHLCV with DatetimeIndex
    orb_minutes  : int — formation window in minutes (default 30)
    bars_per_day : int — 5-min bars per full trading day (default 78)
    """
    orb_bars    = orb_minutes // 5
    signal      = pd.Series(0, index=df.index)
    session_day = df.index.normalize()

    for day in session_day.unique():
        day_mask    = session_day == day
        day_data    = df[day_mask]
        if len(day_data) < orb_bars + 1:
            continue

        orb_high    = day_data["High"].iloc[:orb_bars].max()
        orb_low     = day_data["Low"].iloc[:orb_bars].min()
        post_orb    = day_data.iloc[orb_bars:]

        for i, (idx, row) in enumerate(post_orb.iterrows()):
            if row["Close"] > orb_high:
                signal[idx] = 1    # long
            elif row["Close"] < orb_low:
                signal[idx] = -1   # short
            else:
                signal[idx] = 0

    return signal


# ---------------------------------------------------------------------------
# The Falsification Harness — core institutional criteria checker
# ---------------------------------------------------------------------------

def run_falsification_harness(df: pd.DataFrame,
                               signal: pd.Series,
                               regime_filter: pd.Series,
                               round_trip_cost_points: float = 2.0,
                               point_value: float = 2.0,
                               formation_days: int = 126,
                               test_days: int = 63,
                               min_trades: int = 30,
                               min_tstat: float = 2.0,
                               stability_threshold: float = 0.75,
                               verbose: bool = True) -> dict:
    """
    Apply Mesfin's (2026) five institutional criteria to any intraday signal.

    Walk-forward validation across non-overlapping windows. Reports pass/fail
    for each criterion in each window and an overall verdict.

    Parameters
    ----------
    df                      : pd.DataFrame — OHLCV data
    signal                  : pd.Series — trade signal (-1, 0, +1)
    regime_filter           : pd.Series — boolean regime mask
    round_trip_cost_points  : float — total round-trip cost in index points
    point_value             : float — dollar value per point per contract
    formation_days          : int   — walk-forward training window (trading days)
    test_days               : int   — walk-forward test window (trading days)
    min_trades              : int   — minimum trades per window (Criterion 3)
    min_tstat               : float — minimum T-statistic (Criterion 2)
    stability_threshold     : float — fraction of windows that must pass (Criterion 5)
    verbose                 : bool  — print per-window diagnostics

    Returns
    -------
    dict with keys: window_results, overall_verdict, pass_rate, diagnostics
    """
    bars_per_day    = 78  # approx 5-min bars per session
    cost_per_trade  = round_trip_cost_points * point_value
    prices          = df["Close"]
    filtered_signal = signal.copy()
    filtered_signal[~regime_filter] = 0  # apply regime filter

    # Build walk-forward windows
    unique_days  = pd.Series(df.index.normalize().unique())
    n_days       = len(unique_days)
    window_start = 0
    windows      = []

    while window_start + formation_days + test_days <= n_days:
        form_end  = window_start + formation_days
        test_end  = form_end + test_days
        windows.append({
            "form_days": unique_days.iloc[window_start:form_end],
            "test_days": unique_days.iloc[form_end:test_end],
        })
        window_start += test_days  # non-overlapping

    if not windows:
        return {"overall_verdict": "INSUFFICIENT DATA", "windows": []}

    window_results = []
    for w_idx, window in enumerate(windows):
        test_mask   = df.index.normalize().isin(window["test_days"])
        test_signal = filtered_signal[test_mask]
        test_price  = prices[test_mask]

        # Compute trade P&L
        position    = test_signal.shift(1).fillna(0)
        bar_pnl     = position * test_price.diff() * point_value
        trade_changes = test_signal.diff().abs() > 0
        bar_pnl    -= trade_changes * cost_per_trade / 2  # half cost on entry, half on exit

        # Criterion 3 — trade count
        n_trades    = int(trade_changes.sum())
        c3_pass     = n_trades >= min_trades

        # Criterion 2 — T-statistic
        if n_trades >= 2:
            trade_pnls  = bar_pnl[trade_changes].values
            tstat, _    = stats.ttest_1samp(trade_pnls, 0)
            c2_pass     = tstat > min_tstat
        else:
            tstat       = 0.0
            c2_pass     = False

        # Criterion 4 — positive net return
        net_return  = bar_pnl.sum()
        c4_pass     = net_return > 0

        window_pass = c2_pass and c3_pass and c4_pass

        result = {
            "window":     w_idx + 1,
            "n_trades":   n_trades,
            "t_stat":     round(tstat, 3),
            "net_return": round(net_return, 2),
            "c2_tstat":   c2_pass,
            "c3_trades":  c3_pass,
            "c4_net_ret": c4_pass,
            "pass":       window_pass,
        }
        window_results.append(result)

        if verbose:
            status = "PASS" if window_pass else "FAIL"
            print(f"  Window {w_idx+1:02d} [{status}] "
                  f"Trades={n_trades:3d} | T={tstat:5.2f} | Net={net_return:+7.1f}")

    # Criterion 5 — multi-year stability
    pass_rate       = sum(r["pass"] for r in window_results) / len(window_results)
    c5_pass         = pass_rate >= stability_threshold
    overall_verdict = "PASS" if c5_pass else "FAIL"

    if verbose:
        print(f"\n  Pass rate      : {pass_rate:.1%}")
        print(f"  Stability (C5) : {'PASS' if c5_pass else 'FAIL'} "
              f"(threshold {stability_threshold:.0%})")
        print(f"  OVERALL VERDICT: {overall_verdict}")

    return {
        "window_results":   window_results,
        "overall_verdict":  overall_verdict,
        "pass_rate":        pass_rate,
        "n_windows":        len(windows),
    }


# ---------------------------------------------------------------------------
# Entry point — demo run
# ---------------------------------------------------------------------------

if __name__ == "__main__":
    print("=" * 60)
    print("Strategy Lab #3 — Falsification Harness")
    print("Algorithmic Token · ENTER Invest")
    print("=" * 60)
    print()
    print("Downloading MNQ 5-minute data (max 60 days via yfinance)...")
    print("NOTE: Full 947-day study requires paid intraday data vendor.")
    print()

    df = get_intraday_data("MNQ=F", period="60d", interval="5m")

    if df.empty:
        print("No data returned. Check ticker and data availability.")
    else:
        regime  = compute_regime_filter(df)
        signal  = opening_range_breakout_signal(df)

        print(f"Data loaded   : {len(df)} bars")
        print(f"Regime active : {regime.sum()} bars ({regime.mean():.1%})")
        print()
        print("Running falsification harness (ORB signal)...")
        print()

        results = run_falsification_harness(
            df, signal, regime,
            round_trip_cost_points = 2.0,
            verbose                = True,
        )


# ---------------------------------------------------------------------------
# Risk Disclosure
# ---------------------------------------------------------------------------
# The strategies and implementations in this file are experimental and
# provided for educational and research purposes only. Past performance
# is not indicative of future results. All algorithmic trading carries
# significant financial risk, including the potential total loss of capital.
# Nothing here constitutes financial advice. ENTER Invest does not manage
# client funds based on strategies described here unless explicitly contracted.
# ---------------------------------------------------------------------------Backtest Sketch
The harness above is the backtest. But several assumptions deserve explicit statement:
Data requirement. The full Mesfin (2026) study uses 947 trading days of five-minute MNQ data spanning 2021–2025. yfinance provides at most 60 days of 5-minute data. For a meaningful replication, a paid intraday data vendor is required — Interactive Brokers historical data API, Norgate, or Refinitiv are the practical options. The harness is designed to accept any properly indexed OHLCV DataFrame, so the data source is a plug-in.
Cost assumption. The two-point round-trip cost used in the paper represents approximately one tick bid-ask spread plus commissions for a retail trader on MNQ. At institutional size on the full E-mini (ES), the cost is lower but the point value is five times larger. Scale your cost assumption to your actual execution context.
Walk-forward window sizing. 126-day formation / 63-day test is a standard 2:1 ratio. Shorter formation windows increase the number of walk-forward windows but reduce the signal estimation quality. Longer windows reduce the number of windows and may miss regime changes. The 2:1 ratio is a reasonable default, not an optimized choice.
Regime filter calibration. The volatility and volume thresholds in
compute_regime_filter()are illustrative starting points, not calibrated values. They must be set on formation data only and held fixed for each test window — never fitted to the test period.
Tradability assessment:
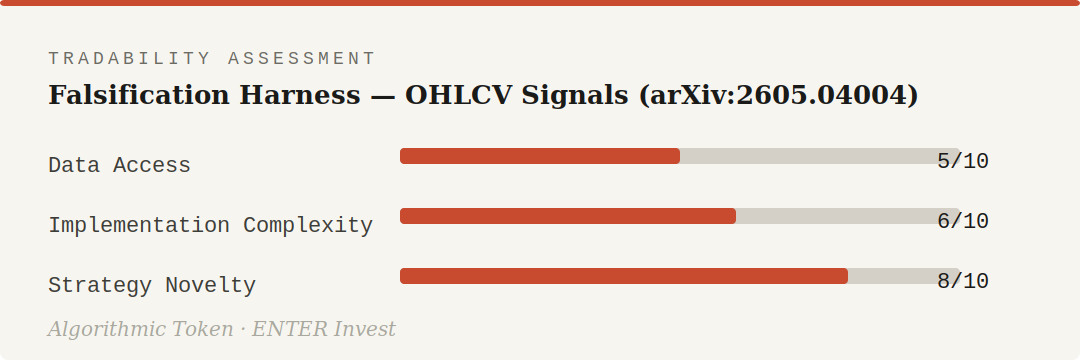
Data access scores lower than previous Labs due to the intraday data requirement. Implementation complexity is moderate — the harness itself is straightforward; the challenge is obtaining and cleaning 5-minute futures data at sufficient depth. Strategy novelty scores high: a falsification-first framework with regime conditioning is a meaningfully different approach from the standard “optimize and backtest” pipeline.
What This Tells Us About Where the Edge Might Be
The falsification study does not say OHLCV signals are useless. It says they are insufficient on their own, at standard parameters, without regime conditioning, applied to a liquid futures market where execution costs are real.
Three directions emerge from the combined evidence:
Direction 1 — Regime-conditioned signal families. The corroborating paper is explicit: signals work during elevated volatility and elevated volume. A signal that passes the harness in high-volatility regimes but is deliberately switched off otherwise is a different strategy from one that runs continuously. That strategy has not been properly tested yet.
Direction 2 — Signal combination. No single signal family passes all five criteria. A composite signal combining two or three families — conditioned on regime agreement rather than individual signal strength — has not been evaluated by the paper. The harness is the right tool to test it.
Direction 3 — Higher-resolution data. Several of the most theoretically motivated signal families — cumulative delta, order flow imbalance, liquidity grabs — require tick-level or order-book data to implement with fidelity. OHLCV approximations of these signals fail not because the underlying concept is wrong but because the data resolution is insufficient. At tick level, these signals may survive the harness. That is a different study.
Strategy Lab #4 will test Direction 1 explicitly — a regime-conditioned ORB signal evaluated against the same five institutional criteria on the full harness.
Implementation Notes
The full Python implementation above will be committed to the ENTER Invest repository under strategy_lab_03/ this week. The harness is designed as a general-purpose testing framework — any signal function that takes a DataFrame and returns a pd.Series of -1/0/+1 can be plugged in and evaluated against the five institutional criteria.
Dependencies:
pip install numpy pandas yfinance scipyFurther reading:
arXiv:2605.04004 — Mesfin (2026), primary reference
arXiv:2512.12924 — Garg (2025), corroborating walk-forward validation study
Pardo (2008) — The Evaluation and Optimization of Trading Strategies — the practitioner’s textbook on walk-forward validation; the institutional criteria in Mesfin (2026) are grounded in Pardo’s methodology
Aronson (2006) — Evidence-Based Technical Analysis — rigorous statistical treatment of signal testing and the multiple-comparison problem in strategy research
Risk Disclosure: The strategies and implementations discussed in Algorithmic Token are experimental and presented for educational and research purposes only. Past performance of any modelled or described strategy is not indicative of future results. All algorithmic trading carries significant financial risk, including the potential total loss of capital. Nothing in this publication constitutes financial advice or an offer to manage investments. ENTER Invest does not manage client funds based on strategies described here unless explicitly and separately contracted to do so. Readers should conduct their own due diligence and consult qualified financial professionals before making any trading or investment decisions.
ENTER Invest · Algorithmic Token · May 2026. Co-developed and co-written by Nuno Edgar Nunes Fernandes, Founder.