

Systematic Edge - The 30 Minute Edge
Systematic Edge — Article 01 by Nuno Edgar Nunes Fernandes

Why the opening range of a trading session encodes more usable information than the hours that follow — and how to extract it with a reproducible, filter-gated framework.
Most retail traders treat the first thirty minutes of a session as noise — a chaotic interval to be survived rather than analysed. The institutional perspective is almost the opposite. The opening range is where overnight positioning resolves, where price discovers the first genuine consensus between buyers and sellers under live session conditions, and where the day’s dominant directional bias often reveals itself before it fully commits. The question is not whether the opening range contains information. The question is how to extract it without being deceived by it.
This article is the first in the Systematic Edge series — a set of methodological notes drawn from the Algorithmic Token trading system currently in paper-trading validation. Every concept discussed here has a working implementation: the Opening Range Breakout strategy described below is live in the system’s stub layer, generating simulated fills with realistic slippage against current market data before any capital is committed to it.
What the Opening Range Actually Encodes
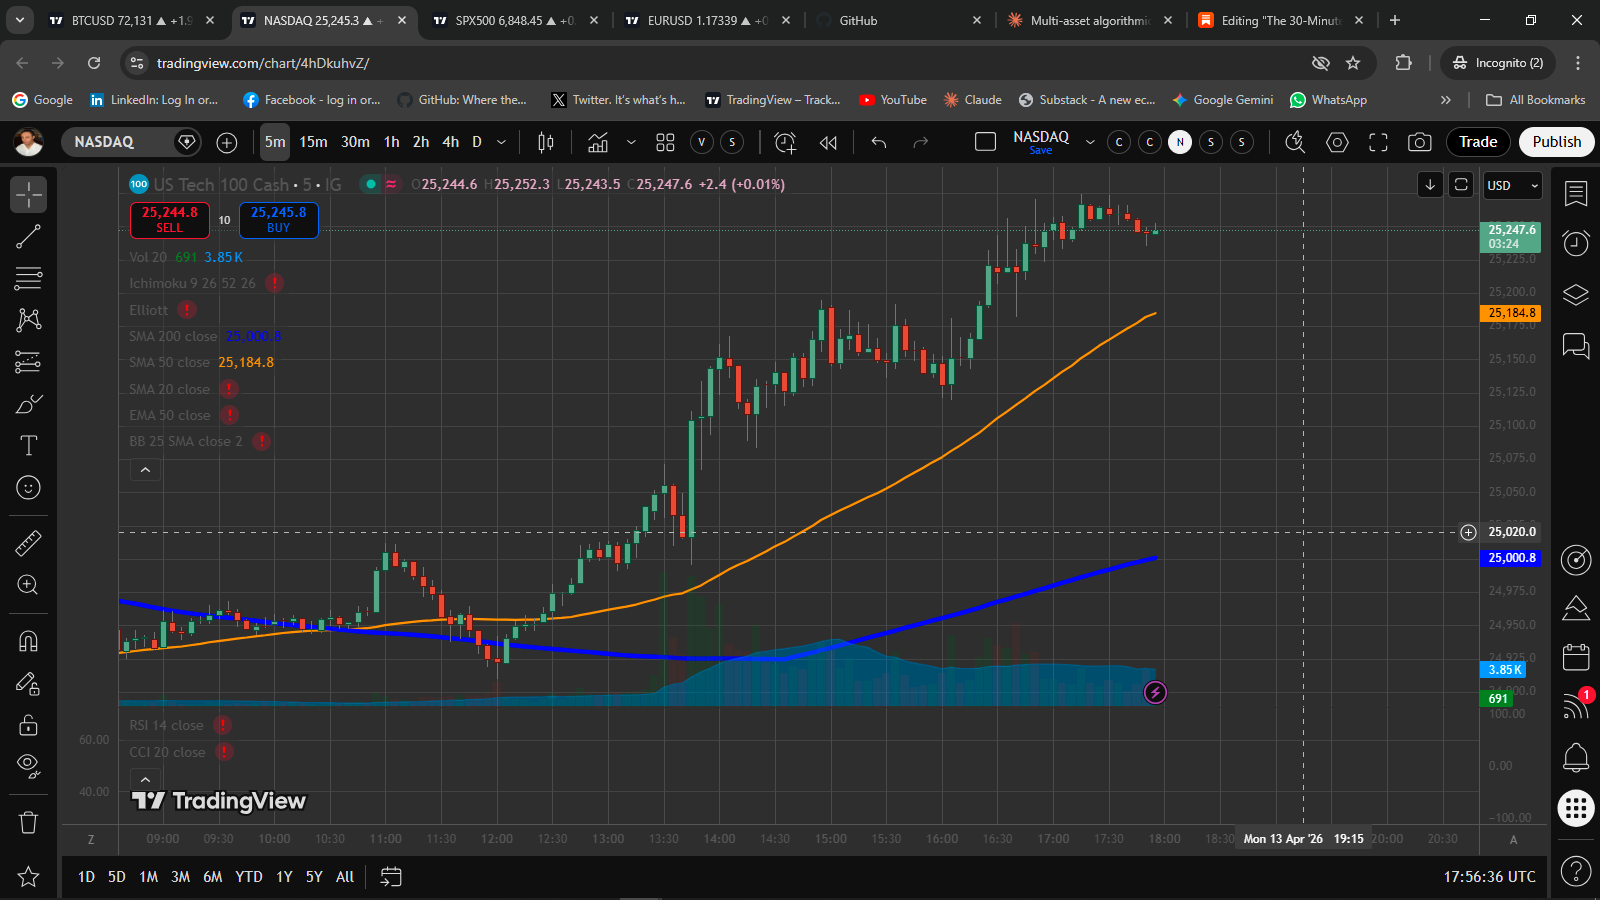
The Opening Range is defined as the high and low established during the first N bars after session open. On a 5-minute chart of NAS100, six bars cover the first thirty minutes — from 09:30 to 10:00 Eastern. During this window, several forces are simultaneously resolving: overnight futures positioning, pre-market news repricing, institutional order flow from fund managers executing at or near the open, and retail stop-loss cascades from prior-session positions.
The resulting range is not arbitrary. Its width encodes the market’s current volatility regime. A narrow range relative to the instrument’s recent Average True Range signals a low-conviction open — institutions are waiting, price has not yet committed. A range that falls within the normal ATR band signals a functional open: genuine two-sided activity that has produced a price structure worth referencing.
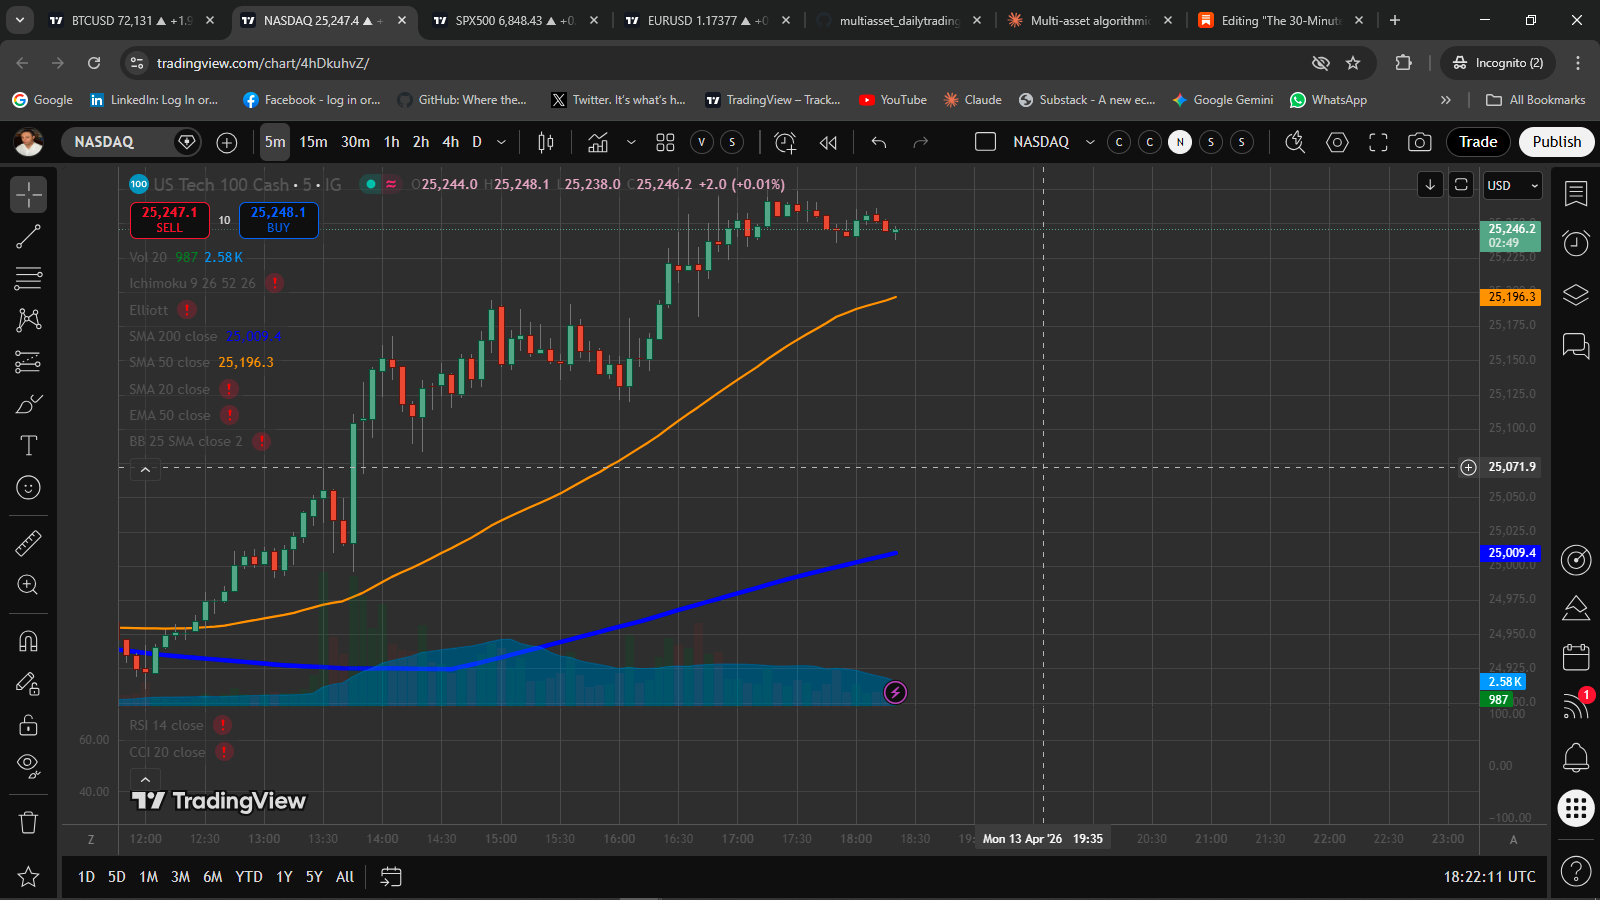
Once the range is established and the formation window closes, price enters the watching phase. The ORB high and low become the day's first structural reference points — levels at which the market has already demonstrated it was willing to pause. A subsequent close above the ORB high, with adequate volume and volatility confirmation, suggests that the consensus formed during the open has been superseded: buyers have absorbed the supply that capped price at the range high and are pushing into new territory. That is the edge.
The ORB high and low are not arbitrary support and resistance lines. They are the price structure produced by the most information-dense thirty minutes of the trading day.
The ATR Filter — The Day-Quality Gate
The ORB setup fails in two specific conditions that a raw implementation ignores. On days when the opening range is unusually narrow — say, the index oscillates within a 15-point band while its 14-period ATR sits at 80 points — a breakout above the range high carries little conviction. The range reflected indecision, not genuine two-sided price discovery, and any breakout is likely to be a false one. On days when the range is unusually wide — a large overnight gap produces an ORB spanning 250 points against a normal ATR of 80 — the stop-loss distance required to respect the range becomes structurally unsound relative to the profit target.
The ATR volatility filter addresses both conditions with a single, configurable check. Before any breakout signal is accepted, the system verifies that the ORB range width falls within a defined multiple of the current ATR:
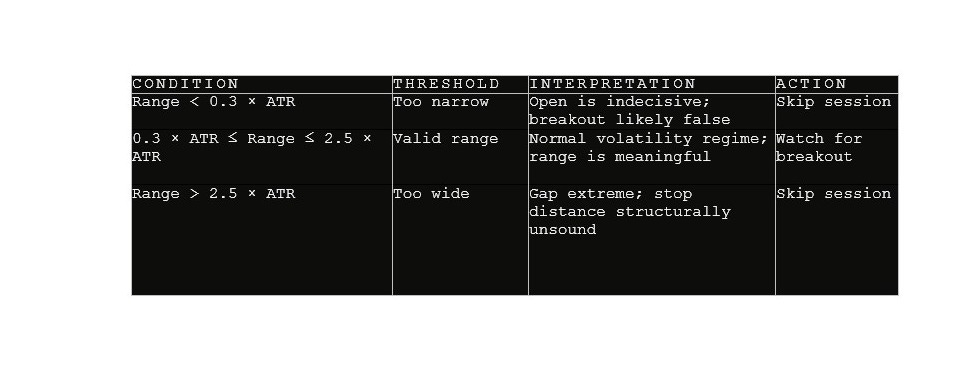
Table 1 — ATR Filter Thresholds (NAS100 · 5m)
Empirically, this filter eliminates roughly 20–30% of potential trading days on NAS100. The days eliminated are disproportionately the losing ones — gap days with no follow-through and low-volatility consolidation days where price meanders across the range boundary multiple times without committing. The filter costs frequency; it returns quality.
Implementation: Full Parameter Set
The strategy is fully implemented in both Pine Script v5 (for TradingView charting and alert generation) and Python (for the backtesting engine and Trading Stub validation layer). The Pine Script indicator is available in the Algorithmic Token repository. The parameter set below reflects the current working configuration for NAS100 on a 5-minute chart:
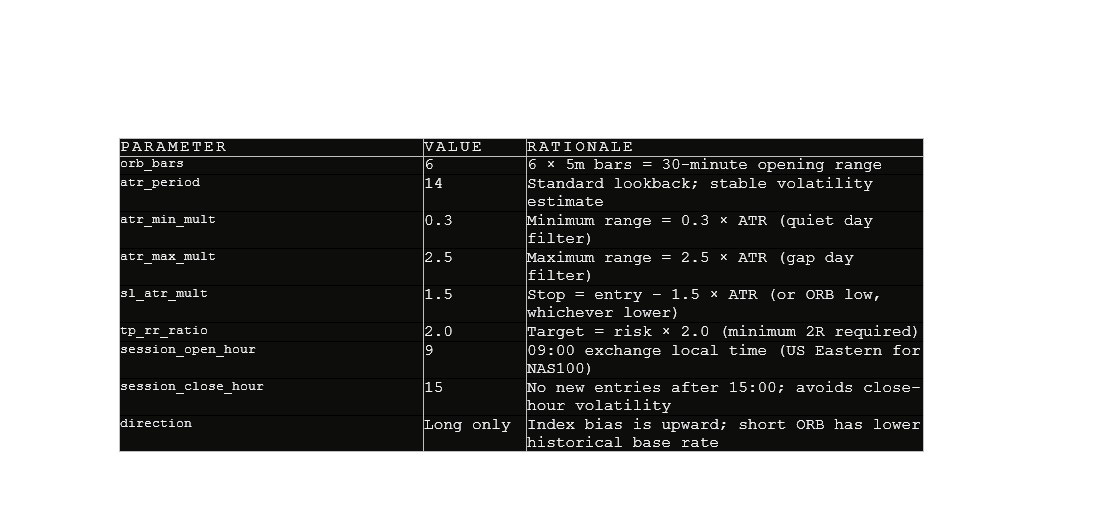
Table 2 — ORB Strategy Parameters (NAS100 · 5m)
The Signal Logic in Pine Script
The breakout detection and ATR filter translate directly into Pine Script. The excerpt below shows the core logic — range validation followed by breakout condition — as it appears in the published indicator. The full source is in the repository.
// ATR volatility filter — accept only normal-regime days
atr_val   = ta.atr(14)
orb_range = orb_high - orb_low
atr_ok    = orb_range >= atr_val * 0.3
         and orb_range <= atr_val * 2.5

// Breakout condition — close above ORB high with buffer
buf         = close * 0.0005
long_break  = orb_set and atr_ok and not traded
           and close > orb_high + buf

// Stop and target levels
long_sl  = math.min(close - atr_val * 1.5, orb_low - buf)
long_tp  = close + (close - long_sl) * 2.0

// Alert condition — routes to webhook when fired
alertcondition(long_break, "ORB Long Breakout",
    "ORB LONG — {{ticker}} broke above opening range")
Stub Validation: What the Numbers Look Like So Far
The graduation gate in the Algorithmic Token system requires a minimum of 50 completed paper trades before any strategy is considered for live deployment. The ORB strategy on NAS100 is currently accumulating that sample. The metrics below are from the stub layer’s current run — early, directional, not yet conclusive — but they illustrate what the reporting framework produces for each session:
55% - Win Rate (early)
1.8R - Avg R-Multiple
1.9 - Profit Factor
6.2% - Max Drawdown
The key figure is not the win rate but the average R-multiple. At 1.8R per winning trade, a strategy needs only a 36% win rate to break even — meaning even a relatively low hit rate produces positive expectancy. The ATR filter is the primary contributor to that R-multiple quality: by eliminating low-conviction days, it concentrates entries into sessions where directional follow-through after the breakout is more likely to extend cleanly to the 2R target.
The One-Session Rule
One operational detail worth stating explicitly: the strategy takes at most one trade per session, and that trade is entered no later than 15:00 local exchange time. The first constraint is a discipline enforcer — once the day’s ORB breakout has occurred, any subsequent re-entry on the same instrument is chasing, not trading a defined setup. The second constraint avoids the closing-hour volatility window that tends to produce poor fills, erratic price action, and positions that need to be held overnight, which the strategy is not designed to do.
Both rules are enforced at the code level in the Python strategy class — _traded_today flips to True after the first signal, and _after_session_close() returns None unconditionally after the defined hour.
A strategy that requires human discipline to enforce its own rules is not a systematic strategy. It is a discretionary one wearing systematic clothing.
The full implementation — Pine Script indicator, Python strategy class, webhook pipeline, and Trading Stub — is documented in the Algorithmic Token repository. Performance data will be published here as the stub sample builds toward the 50-trade graduation threshold.
Nuno Edgar Nunes Fernandes ENTER Invest · Algorithmic Token
very nice. Might be interesting to combine this setup with the volatility scaling explained in your recent article