

Why Your Stop-loss is a measurement problem
Systematic Edge #2 by Nuno Edgar Nunes Fernandes · 14 April 2026 - ENTER Invest Algorithmic Token

Fixed pip stops assume constant market volatility. The market ignores that assumption entirely. Here is what happens when you stop treating stop-losses as arithmetic and start treating them as functions of the environment they live in.
The stop-loss is the most psychologically fraught element of any trade. It is the number you set before entering, the line you commit to honouring, and the one most likely to be violated — either by moving it in the wrong direction mid-trade or by setting it so tightly that the market takes it out on noise before the directional move even begins. Neither failure is a discipline problem. Both are, at root, a measurement problem.
A fixed-pip or fixed-point stop — “20 pips on every EUR/USD trade,” “50 points on NAS100” — makes an implicit claim about the market: that the level of noise present in the instrument is constant across sessions. It is not. On a quiet Tuesday in June, EUR/USD might have an Average True Range of 38 pips. On a Friday following a US CPI print, that same ATR might be 115 pips. A 20-pip stop on the second day is not a stop. It is a donation.
This is what is meant by a stop that lies. It presents as a risk management decision. It performs as a random exit that is uncorrelated with trade logic and negatively correlated with market conditions.
The Noise Floor Problem
Every market has a noise floor: the minimum price movement that occurs without any directional intent, produced by spread, slippage, order book oscillation, and the natural variance of bid-ask activity during a given session. If your stop is set within that noise floor, the market will find it. Not because the trade thesis was wrong, but because price normally oscillates at least that far on any given bar.
The Average True Range over 14 periods is the most practical estimate of that noise floor. It measures the average of the true range — which accounts for overnight gaps as well as intrabar movement — across the most recent 14 sessions. When you set a stop at 1.5 × ATR below your long entry, you are saying: the trade is wrong if price moves one and a half times the normal session range against me. That is a claim with empirical content. A fixed-pip stop contains no such claim.
A fixed-pip stop tells you it is the same risk every time.
It is not. The market's noise floor changes every session.
The table below shows what happens to a 20-pip fixed stop across three volatility regimes on EUR/USD — and how an ATR-based stop responds to the same conditions. The contrast is straightforward but the implications run through every aspect of position sizing, expectancy, and the interpretation of a strategy's win rate.
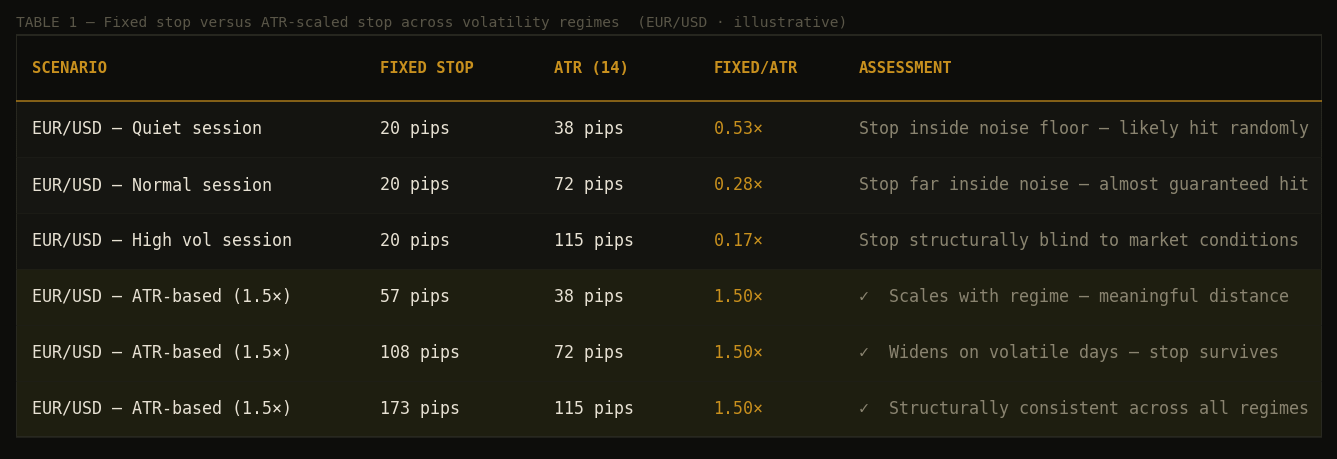
The ratio in the fourth column is what matters. A 20-pip fixed stop against a 38-pip ATR is already inside the noise floor. Against a 115-pip ATR — a reasonably common condition during a major data release — it is 0.17 of the noise floor. The market is not triggering that stop because the trade is wrong. The market is triggering it because the market exists.
What Changes When You Switch to ATR Stops
Three things change immediately and permanently when stop placement becomes a function of ATR rather than a fixed constant.
Stop placement becomes honest. On quiet days the stop is tighter in absolute terms — because the noise floor is genuinely lower and a smaller move away from entry is meaningful. On volatile days the stop widens — because the noise floor is higher and the same absolute distance means less. In both cases the stop is calibrated to what the instrument actually requires to make an error, not to an arbitrary number from your trading plan that was probably set during a medium-volatility session anyway.
Position sizing becomes consistent. If your risk amount per trade is fixed — say, 1% of account — and your stop distance changes with ATR, then position size automatically adjusts. On high-volatility days you take smaller positions because your stop is wider. On quiet days you take larger positions because your stop is tighter. You are not choosing this; the system is choosing it, consistently, on every trade, without discretionary interference. This is one of the clearest examples of a systematic edge over discretionary trading.
Win rate becomes interpretable. A strategy’s win rate is meaningless if the stop is not placed at a structurally consistent distance from entry. Fifty trades with a random stop distance produce a win rate that reflects the stop distance distribution, not the strategy’s edge. Fifty trades with stops at 1.5 × ATR produce a win rate that reflects one consistent question: does this strategy produce trades that move more than one and a half times the daily noise range in the predicted direction? That question has a stable answer across varying market conditions. The other one does not.
Implementation in the Algorithmic Token System
The Python strategy class enforces ATR-based stop placement at the signal construction level. No strategy in the system can submit a signal with a fixed-distance stop — the stop is always computed from the current bar's ATR value, which the backtesting engine calculates and injects as a named indicator before each bar is processed.
strategies/orb_strategy.py

# Stop and target computed from current ATR — never fixed distance
def _build_long_signal(self, bar: Bar) -> Signal:
    atr_val = bar.indicators["atr"]          # current session ATR
    entry   = bar.close

    # Stop = lower of: 1.5×ATR below entry, or just below ORB low
    sl = min(entry - atr_val * 1.5, self._orb_low - buf)

    risk = entry - sl               # risk in price units
    tp   = entry + risk * 2.0      # 2R minimum target

    return Signal(
        stop_loss   = sl,
        take_profit = tp,
        atr         = atr_val,      # logged for audit trail
        ...
    )
The ORB strategy adds a second anchor: the stop is placed at the lower of entry − 1.5 × ATR or just below the ORB low. This means the stop is always structurally grounded in the range that defined the setup — not floating in empty price space.
The same logic is applied in Pine Script for the TradingView indicator:
Pine Script v5
                                                pine_scripts/orb_strategy.pine

atr_val = ta.atr(14)
buf     = close * 0.0005

// Stop anchored to ATR AND structural level — whichever is lower
long_sl = math.min(close - atr_val * 1.5, orb_low - buf)
long_tp = close + (close - long_sl) * 2.0
The result is a stop that adapts to the session automatically. Today's NAS100 ATR is running approximately 165 points — elevated relative to the 30-day average of around 120 points, reflecting the higher-than-normal volatility of the current geopolitical environment. A stop set at 1.5 × 165 = 248 points below entry is a genuinely different stop from the same strategy's placement on a quiet day at 1.5 × 90 = 135 points. Both are correct. A fixed-point stop would be correct for at most one of them.
SYSTEM RADAR
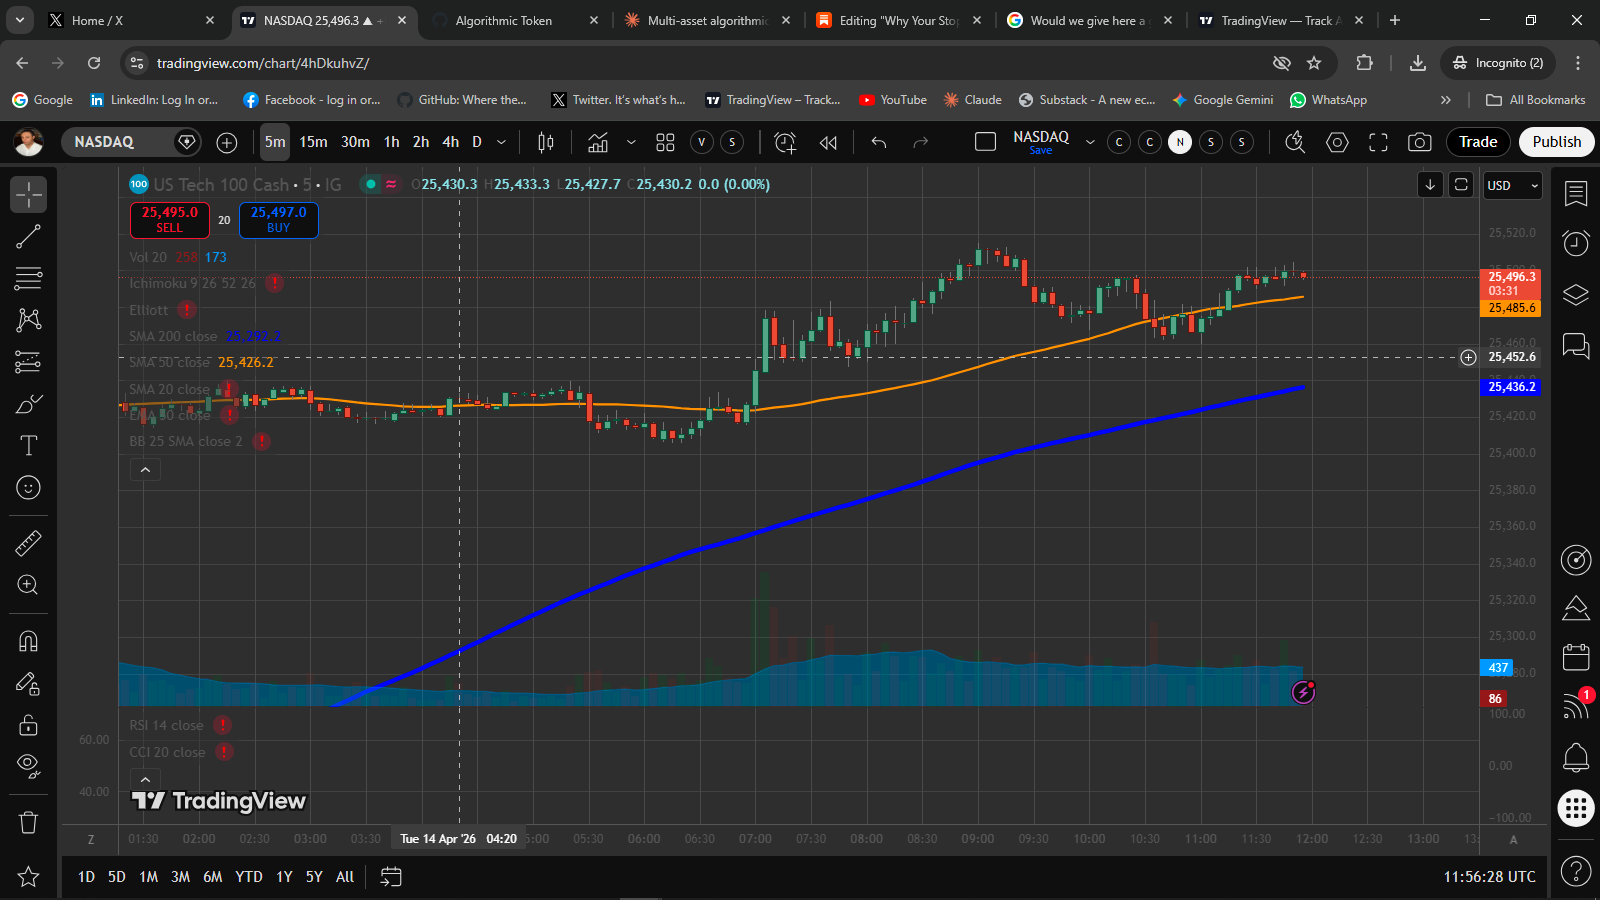
Today’s Setup — NAS100 · ORB Long
The Algorithmic Token stub is watching NAS100 on the 5-minute chart for an ORB long breakout this session. The macro backdrop is relevant: the S&P 500 closed Monday at 6,886 — its highest level since before the Iran conflict began, with the Nasdaq gaining 1.23% to 23,183, driven by renewed hopes of a diplomatic resolution between Washington and Tehran after Trump indicated Iran had made contact seeking negotiations.
The ATR on NAS100 is running elevated at approximately 165 points on the daily — roughly 38% above its 30-day average. This matters for the ORB filter: the range formed in the first 30 minutes needs to fall between 0.3 × 165 = 49 points (minimum, to avoid a flat open) and 2.5 × 165 = 413 points (maximum, to avoid a gap extreme). Given the current geopolitical sensitivity around the Strait of Hormuz situation, the gap-filter on the upper end is doing meaningful work this week — it would have blocked entries on the most volatile open sessions of the past fortnight.
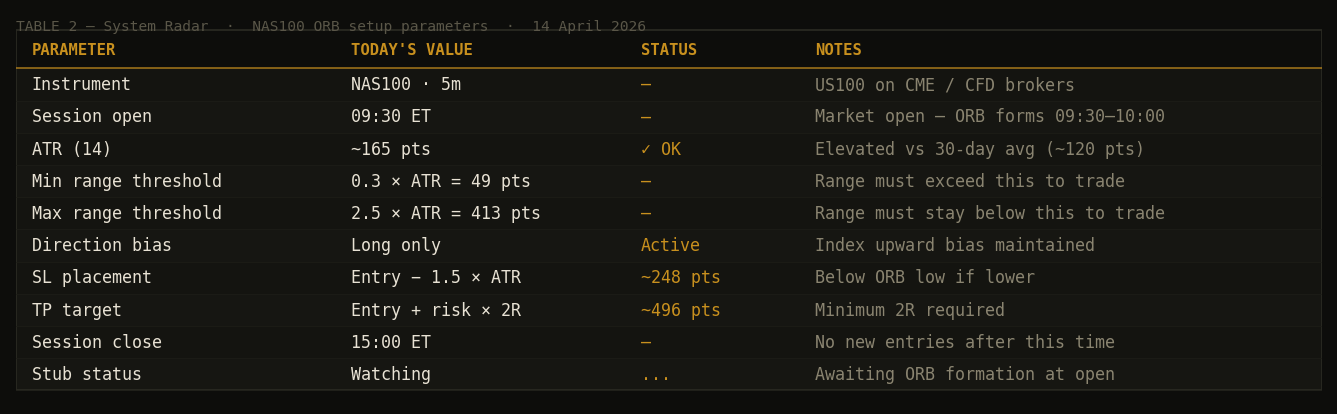
If the signal fires: a long entry is taken on the first 5-minute bar close above the ORB high with a small buffer. Stop is placed at the lower of entry − 1.5 × ATR or just below the ORB low. Target is 2R. One trade only for the session.
If the ATR filter blocks the signal: no trade is taken today. This is not a failure; it is the filter functioning as intended. The system does not require a trade every day. It requires trades only when the setup conditions are met.
ANALYST’S EYE
Two Setups Worth Watching This Week
Outside the systematic layer, two situations in commodities and FX stand out this week as setups worth tracking — not as system-generated signals, but as examples of the analytical process applied to current market conditions.
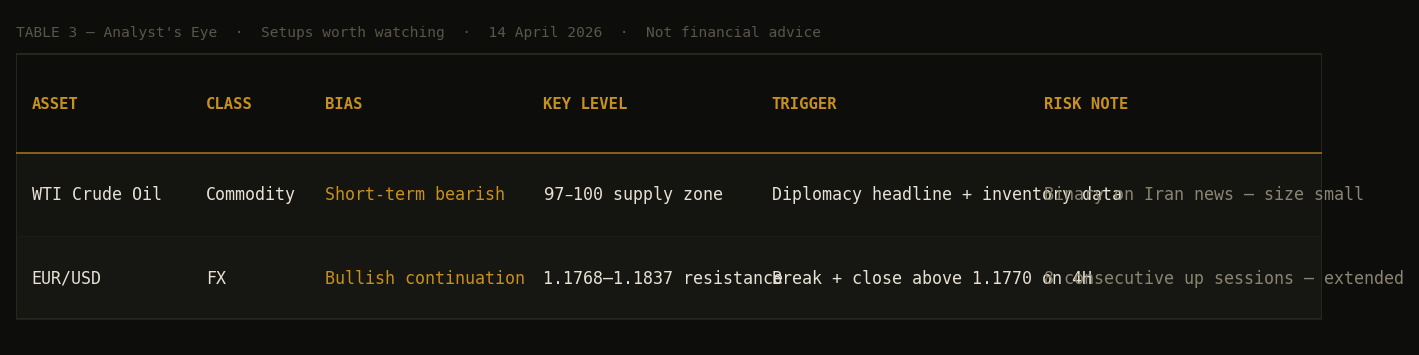
WTI Crude Oil — The Narrative Whipsaw
WTI crude dipped 1.88% to $97.22 on April 14, having surged over 8% last week on collapsed US-Iran peace talks and fears of a Strait of Hormuz blockade, testing four-year highs around $114. The EIA inventory data and any diplomatic headline can move this instrument 3–5% in either direction intraday, making it unsuitable for the ORB system’s position sizing model as currently configured. But as an analytical observation: OPEC+ output fell 7.9 million barrels per day in March largely due to the Hormuz shutdown, and the market is now pricing a ceasefire extension. That gap between supply reality and diplomatic optimism is where reversals happen.
The observation is simple: if the two-week ceasefire holds and diplomacy advances this week, the geopolitical risk premium in oil — currently running between $10 and $20 above the fundamental supply-demand level — compresses quickly. That is a mean-reversion candidate, not a directional trend trade. Position sizing should reflect the binary nature of the driver. The IEA monthly market report and any progress in Iran negotiations are the key data points to watch before committing.
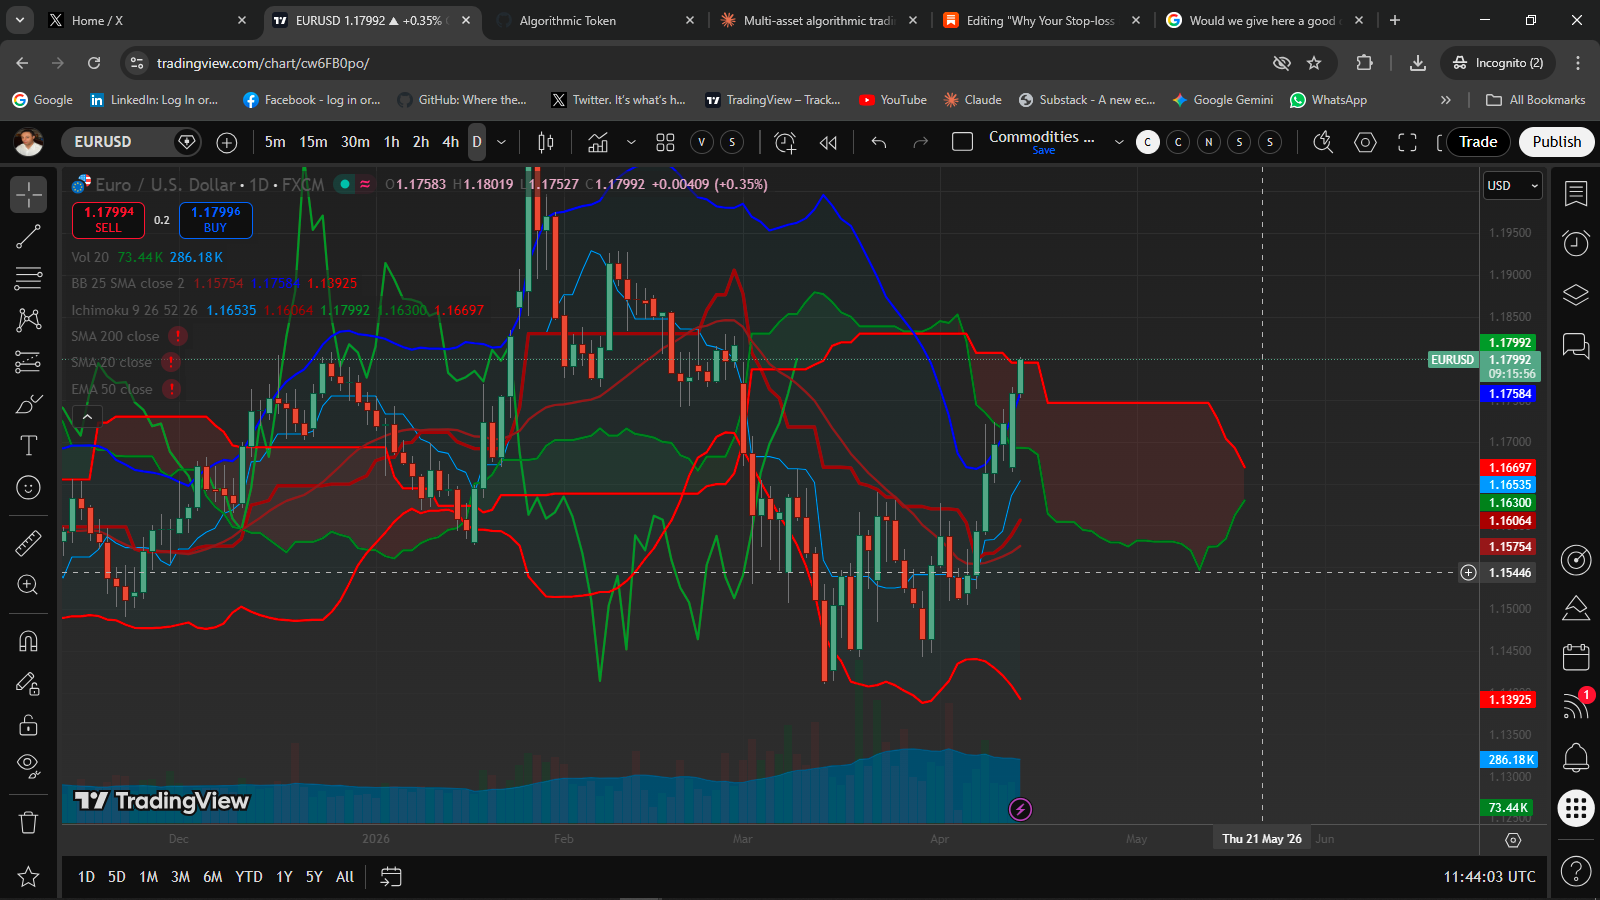
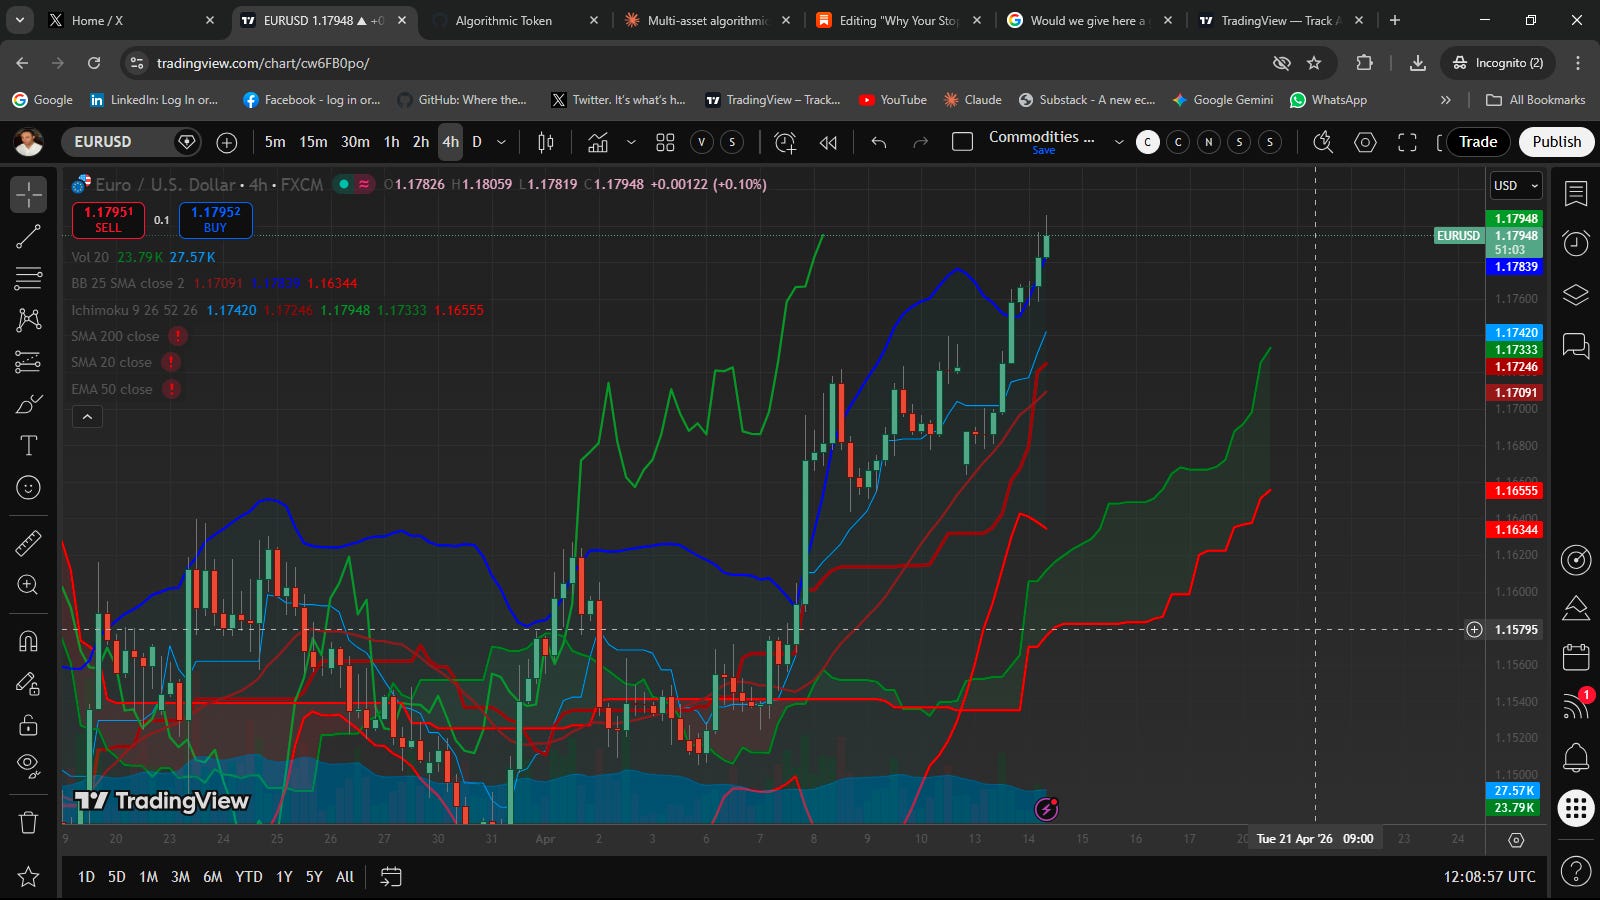
EUR/USD — The Diplomacy Trade in FX
EUR/USD has advanced for eight consecutive sessions, touching the 1.1765–1.1770 band — its strongest level since early March — as expectations that diplomatic channels with Iran remain open and uncertainty over Federal Reserve policy weigh on the US dollar.
This is the FX expression of the same macro trade playing out in equities: risk-on positioning as the conflict shows signs of moving toward resolution. The structural argument for EUR/USD upside is straightforward. Currency strategists in a Reuters poll hold the view that the dollar’s modest safe-haven rebound since the conflict began will fade as its appeal erodes — and that as soon as oil retreats below $90, EUR/USD would move above 1.18 rapidly.
The technical setup is the question. Eight consecutive sessions of gains is extended by any measure. The dollar index was near its weakest level since March 2, the first trading day after the war began. That is a meaningful retracement in a short time. The entry case is stronger on a confirmed break and close above 1.1770 on the 4-hour chart — not a chase of an already-extended move. A pullback toward the 1.1680–1.1700 zone with subsequent recovery would be the cleaner long setup if it materialises before the end of the week.
System Radar and Analyst's Eye sections present output from the Algorithmic Token systematic framework and analytical observations on current market structure. They are educational in nature and do not constitute financial advice. Setups described are reviewed by the Trading Stub before any capital is committed. Do your own analysis and consult a qualified adviser before making any trading decisions.
Nuno Edgar Nunes Fernandes ENTER Invest · Algorithmic Token